Infrared thermography is the process of using a thermal
imager to detect infrared radiation (heat) that is emitted by an object.
The technology allows operators to validate normal operations and, more
importantly, locate thermal anomalies (abnormal patterns of heat
invisible to the eye) which indicate possible faults, defects or
inefficiencies within a system or machine asset.
A few examples of where infrared is applied in industrial situations include:
When it comes to inspecting mechanical equipment with infrared, certain conditions are needed. It is also important for the thermographer to have a strong foundation of basic radiometry and heat transfer, knowledge of how the mechanical equipment operates, as well as a solid background on the infrared camera’s capabilities and limitations. As with any type of technology, proper training is essential to successfully operate these systems.
Baseline inspections, where a thermographer captures an overall “thermal map” of a particular equipment type, is one of the more valuable uses of the technology, as subsequent inspections are then compared to the original “map” to detail any changes that may have occurred over time. The examples in this article represent only a few of the many areas where IR is utilized for inspecting mechanical equipment in an industrial facility.
While there are many ways to monitor the electrical and mechanical conditions of a motor, thermal imaging has proved itself to be useful mainly as a quick and efficient screening tool. We know that heat is created in any number of ways – by excessive friction, high electrical resistance, reduction of cooling air or fluids and problems with current flow in a motor. If an issue is detected, in the form of an abnormal thermal signature seen in the infrared image – an additional test method such as vibration analysis, airborne ultrasonics or motor circuit analysis – is typically requested to help pinpoint exactly what is causing an anomaly.
Thermography is also used to monitor temperatures on high-temperature refractory insulation such as a rotating kiln, furnace or boiler. Thermal patterns detected in these cases can be used to monitor the condition of the insulation or even calculate the thickness of the remaining refractory. This type of monitoring is invaluable as it facilitates planned maintenance outages and repair of a problem area vs. a catastrophic, and expensive, unplanned failure.
Both insulation and heat-tracing on process lines can also be inspected with infrared. Applications such as detecting line blockages, monitoring line temperatures, locating damaged or missing insulation can be accomplished with infrared with a few exceptions. Lines covered with very high levels of insulation are more problematic as are process lines that are wrapped with shiny aluminum or stainless steel sheet metal coverings. Inspecting in these situations can be very difficult due to the high thermal reflectivity/low emissivity of the surfaces encountered.
Similar to inspecting line blockages, the different thermal capacities of solids, liquids, and gases and the way heat moves in and out of them mean these materials change temperature at different rates during a transient heat flow cycle. Gases, having the lowest thermal capacity of them all, typically change most quickly. Solids, with varying capacitances do not change as rapidly because slower, conductive, heat flow controls the temperature next to the tank wall. Floating materials, including waxes, can usually be distinguished from the liquid due to capacitance differences. Liquids typically take the longest to change because of their high thermal capacitance.
In summary, mechanical infrared inspections can be challenging and rewarding both financially and professionally. The person performing the inspection must have an adequate working knowledge of the equipment they are inspecting as well as sufficient heat transfer theory training to interpret the thermal patterns they observe. As with any predictive maintenance technology, thermography is only one tool in the technician’s toolbox. All the applicable predictive tools should be utilized to give the best possible picture of an asset’s health.
CREDIT:About the authors:
Harold Van De Ven is an instructor and consultant and John Snell is a principal for The Snell Group. For more information on infrared thermography, visit www.thesnellgroup.com.
A few examples of where infrared is applied in industrial situations include:
- Electrical Systems (faulty electrical connections or overloaded circuits)
- Mechanical Equipment (abnormally warm motors or possible bearing failures)
- Fluid Systems (line blockages, tank levels or pipe temperatures)
- Building Applications (detect missing insulation, air infiltration or moisture damage)
- Low-Slope Roofs (locate wet roof insulation)
When it comes to inspecting mechanical equipment with infrared, certain conditions are needed. It is also important for the thermographer to have a strong foundation of basic radiometry and heat transfer, knowledge of how the mechanical equipment operates, as well as a solid background on the infrared camera’s capabilities and limitations. As with any type of technology, proper training is essential to successfully operate these systems.

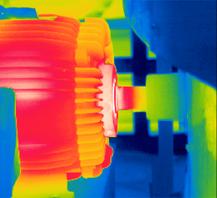
Figure 1: The causes of an abnormally warm motor
bearing are not always obvious but infrared is a key means of finding
those which are running hot.
Inspecting mechanical equipment with infrared thermography covers a
wide variety of systems, everything from motors, rotating equipment,
steam traps, refractory, and tank levels and more. Most of these
inspections de-emphasize taking absolute temperature measurements and
instead concentrate on comparing overall thermal patterns to understand
the asset’s health. Baseline inspections, where a thermographer captures an overall “thermal map” of a particular equipment type, is one of the more valuable uses of the technology, as subsequent inspections are then compared to the original “map” to detail any changes that may have occurred over time. The examples in this article represent only a few of the many areas where IR is utilized for inspecting mechanical equipment in an industrial facility.
While there are many ways to monitor the electrical and mechanical conditions of a motor, thermal imaging has proved itself to be useful mainly as a quick and efficient screening tool. We know that heat is created in any number of ways – by excessive friction, high electrical resistance, reduction of cooling air or fluids and problems with current flow in a motor. If an issue is detected, in the form of an abnormal thermal signature seen in the infrared image – an additional test method such as vibration analysis, airborne ultrasonics or motor circuit analysis – is typically requested to help pinpoint exactly what is causing an anomaly.

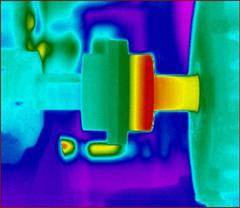
Figure 2: Couplings often exhibit strong thermal signatures when there is misalignment or related problems.
Abnormal heating, such as what might occur in a misaligned coupling,
could precede a detectable vibration signature. Left alone, such an
issue compounds itself as it continues to get worse or even wear on the
motor bearing itself. That in turn can also typically be detected with
thermography. A variety of issues that are related to the motor’s
electrical system may also have thermal patterns associated with them.
An internal fault because of the breakdown of insulation on the motor
windings can increase the overall temperature of the motor including the
motor housing. Often, when the cooling air flow pathways become blocked
in a motor, the winding insulation also fails.
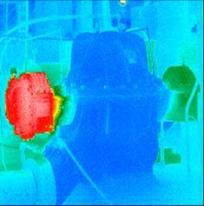
Figure 3: Infrared thermography
is often used to locate suspected problems in bearings which can then be
confirmed with other technologies.
Inspecting bearings is another useful application for infrared
thermography. Abnormal friction within a bearing, generating heat,
causes the bearing’s surface temperature to rise. This thermal
signature, when detected, is an indication of a potential bearing
problem, anything from under-lubrication, over-lubrication, poor
maintenance or simply a bad bearing. Infrared is especially helpful for
inspecting low-speed equipment, including overhead conveyors or idlers,
quickly and easily.Thermography is also used to monitor temperatures on high-temperature refractory insulation such as a rotating kiln, furnace or boiler. Thermal patterns detected in these cases can be used to monitor the condition of the insulation or even calculate the thickness of the remaining refractory. This type of monitoring is invaluable as it facilitates planned maintenance outages and repair of a problem area vs. a catastrophic, and expensive, unplanned failure.

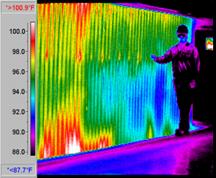
Figure 4: Thermography is a perfect tool for
inspecting boiler refractory and air leakage issues. The location of
failing refractory can be trended and, when alarm temperatures are
determined, repairs can be scheduled.
With the cost of energy increasing, steam traps are another
application where infrared thermography can provide valuable savings for
a facility. This is accomplished by detecting failures of traps that
are stuck open. While airborne ultrasonics is considered a primary test
method for this application, infrared inspections can be completed
quickly and easily, even at some distance from the device. A trap that
is functioning properly will typically have a large temperature
difference between the steam and condensate sides. This temperature
difference will temporarily disappear as it cycles. If both sides of the
trap are warm it is an indication that the trap has failed open, a
condition that can cost literally thousands of dollars in a year.Both insulation and heat-tracing on process lines can also be inspected with infrared. Applications such as detecting line blockages, monitoring line temperatures, locating damaged or missing insulation can be accomplished with infrared with a few exceptions. Lines covered with very high levels of insulation are more problematic as are process lines that are wrapped with shiny aluminum or stainless steel sheet metal coverings. Inspecting in these situations can be very difficult due to the high thermal reflectivity/low emissivity of the surfaces encountered.

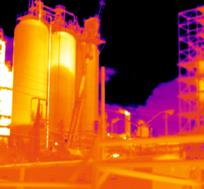
Figure 5: It is possible to locate levels in tanks and
silos when they are in thermal transition, providing key information or
confirming existing data.
Finally, one of the easier mechanical applications of thermography is
to locate levels of gases, liquids, fluidized solids and even sludge in
tanks, vessels and silos. Although most storage tanks have a gauge to
detect levels, these sensors often fail or must be independently
confirmed due to the critical nature of a process.Similar to inspecting line blockages, the different thermal capacities of solids, liquids, and gases and the way heat moves in and out of them mean these materials change temperature at different rates during a transient heat flow cycle. Gases, having the lowest thermal capacity of them all, typically change most quickly. Solids, with varying capacitances do not change as rapidly because slower, conductive, heat flow controls the temperature next to the tank wall. Floating materials, including waxes, can usually be distinguished from the liquid due to capacitance differences. Liquids typically take the longest to change because of their high thermal capacitance.
In summary, mechanical infrared inspections can be challenging and rewarding both financially and professionally. The person performing the inspection must have an adequate working knowledge of the equipment they are inspecting as well as sufficient heat transfer theory training to interpret the thermal patterns they observe. As with any predictive maintenance technology, thermography is only one tool in the technician’s toolbox. All the applicable predictive tools should be utilized to give the best possible picture of an asset’s health.
CREDIT:About the authors:
Harold Van De Ven is an instructor and consultant and John Snell is a principal for The Snell Group. For more information on infrared thermography, visit www.thesnellgroup.com.

No comments:
Post a Comment